
Charts

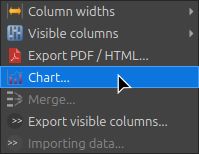
Charts can be created from any data tab (right-click)
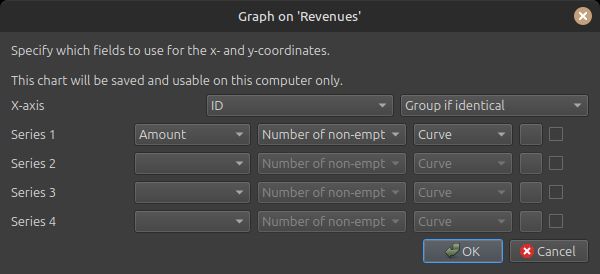
X-axis = horizontal axis; select the column. There can be one data point per line, or a single data point representing multiple lines.
Y-axis = vertical axes (left and right); up to 4 series can be configured.
Series display type:
- line
- points
- bars
Certain combinations of data type and display type are incompatible and may result in incorrect display.
Line grouping
The row grouping rule is specified for the x-axis. The available grouping rules depend on the data type of the x-axis column (text, dates, numbers).
For each series, you must specify the calculation to be performed on the grouped data. The available calculations depend on the data type of the x-axis column (text, dates, numbers).
Dates serie
“One series per year” unchecked: The time range on the x-axis will extend from the earliest date to the latest date and may span several years.
“One series per year” checked: The time range on the x-axis will extend from January 1 to December 31; only Series 1 is configurable, and one data series will be created for each year listed in the column.